Connect to Qlik Sense
To connect to Qlik Sense Enterprise (on-premises), refer to Configuring Qlik Sense Enterprise Connection. To connect to Qlik Sense Cloud, refer to Configuring Qlik Sense Cloud Connection.
Create a template
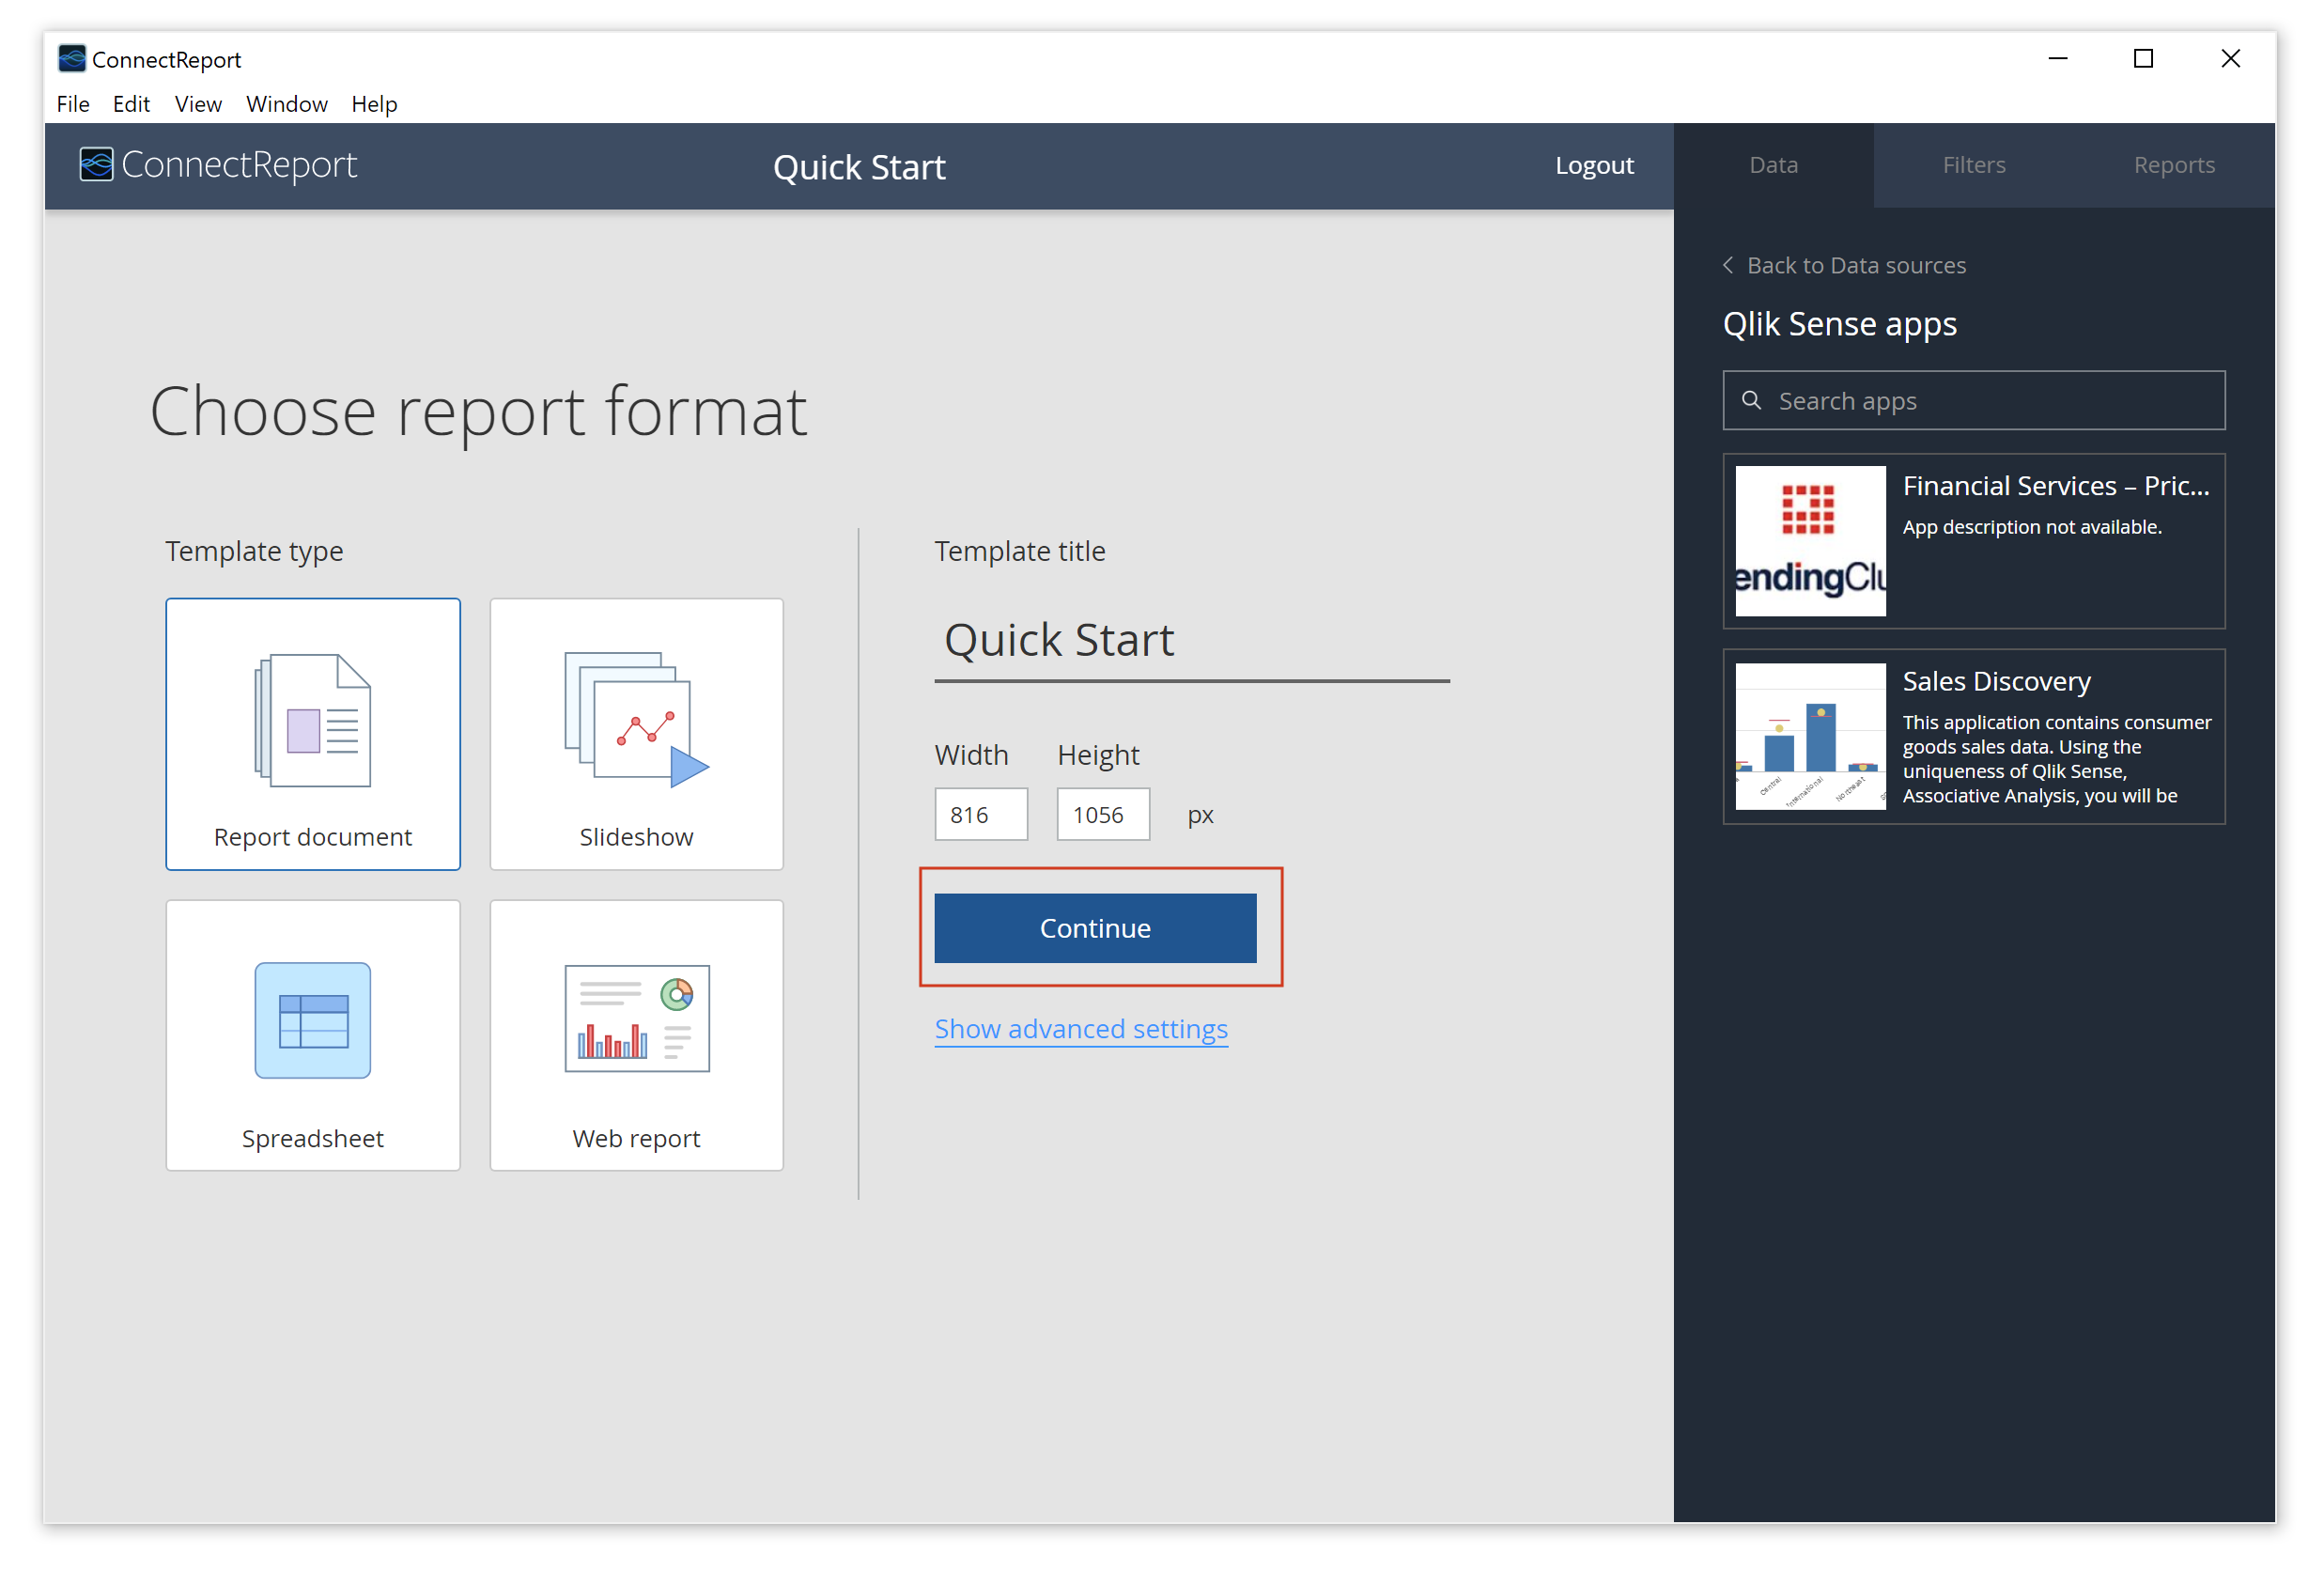
Now that you've selected Qlik Sense as your data source, you can start building a report template. Whenever you create a new template, you have the option of selecting from four report formats: Report Document, Slideshow, Spreadsheet, or Web template. We recommend choosing the Report Document type for your first template.
To proceed, click Continue

Add data visualizations
Now that your template is configured, select a Qlik Sense app in the data sidebar. Choose a visualization you'd like to report on, and drag it into the editor stage.
Add tabular data
Once you've added a data visualization, you may also need to share more granular insights using tabular data. ConnectReport supports several ways to add tables using data from Qlik Sense to meet the demands of any reporting workload. In this guide, we will add the data associated with the visualization we just added.
First, we'll click the small + symbol next to the visualization you added. From here, you can see the fields that underly this visualization. You can drag in the entire table, or individual dimensions and measures.
If you want to take your reporting further right away, you can also configure the table via the Table ribbon menu to apply sorting, limits, totals, and several other options.
Filter your data
With several key items added to your report, a common next step for many report authors would be to apply filters. In this example, we will apply a filter on Location to the entire report page, so that we filter both the visualization and the table.
To apply filters to tables, visualizations, or pages, click on the Filters tab of the sidebar. From here, you can drag in Qlik Sense Bookmarks, or create your own selections. We will create our own selection on 'Grade / Location' and select 'A'. Once applied, you can right click on any data object on the page and click Display filters in report to provide information on the applied filters to your report viewers. After applying your selections, you can click to expand the Live Preview to view a larger preview of your report
Wondering about more advanced filtering capabilities? ConnectReport supports nearly unlimited combinations of ways to filter your data at several different layers. The most basic filter is one applied at the object level, e.g., to a table or visualization. You can also apply filters to report tasks, template pages, and in ConnectReport Enterprise, you can leverage Filter Cycles to automate your bulk reporting workloads.
Style your template
Now that your simple report is nearly complete, it's time to add some style. ConnectReport provides the capabilities necessary to meet your branding and report design needs, and share compelling stories about your data.
To get started, we have added a title and logo. To add text, right click anywhere on a page and click Add text box. To format text (including text inside tables), click on Format in the ribbon menu to apply styles to your text. To add an image, click Insert in the ribbon menu and select an image from your file system to add to your report.
To change the color scheme of a table, click on the table menu and choose or customize a color scheme.
Export reports
Once your report is ready to go, you can export it to several different formats. To export your report, navigate to View in the ribbon menu and click on the desired format.
In ConnectReport Enterprise, you can share reports to a governed portal where downstream report consumers can view and download reports in various formats. ConnectReport Enterprise also supports distributing reports via email, and retrieving reports through an API.
Schedule reports
You can set your report to publish to the portal automatically on a schedule or as a once off task. To schedule your report, navigate to Reports in the right-hand sidebar menu and click on Report Later.
To set the frequency of your scheduled report, click on the Frequency dropdown. You can choose from Once - Now, Once - Later, Daily, Monthly, Weekly, or Annual frequencies.
You can also apply filters to a report task. To apply filter, click on the Filter section of the Report sidebar.
Multiple report tasks can exist on a given template, allowing you ultimate flexibility on when and how you choose to distribute your reports to different audiences.
All set
Now that you've gotten a brief overview of ConnectReport's live report template editor, you're equipped to tackle the challenges of reporting in a modern BI ecosystem with grace, simplicity and flexibility. With ConnectReport in your back pocket, you can accelerate insight delivery and share compelling stories around your data with your customers and colleagues with ease.