10 Key Capabilities for Qlik Sense Reporting Tools
Read this before picking a Qlik Sense reporting tool. We analyze 10 key areas to look at when evaluating Qlik Sense reporting capabilities.
We’ve distilled Qlik Sense reporting requirements into 10 key areas to evaluate potential solutions on. Read on to uncover how 3 key solutions in the marketplace meet these capabilities.
There are many solutions out there to cover requirements for pixel-perfect reporting on Qlik Sense. From features already built-in to Qlik Sense, to Qlik-supported NPrinting, to powerful third-party products and NPrinting alternatives, there’s a wide spectrum of reporting software to address the unique needs of every case and budget. Your use case for reporting may be a simple need for on-demand dashboard exports to PDF, or highly complex. Complex Qlik Sense reporting use cases might require integration with other applications, white-labeling, use of APIs and mashups, complex report formatting, or high-scale automated or scheduled report processing.
Wherever your scenario lies, we break down how three different solutions fit into the 10 capability areas. The three solutions we evaluate are Qlik Sense built-in capabilities, Qlik NPrinting, and ConnectReport. From here, we’ll dive into the pricing and license model for each solution.
The 10 Key Capabilities:
Your needs in each area of capability will vary, depending on your workflow, resources, and other requirements and constraints. Before you dive into a solution, you should understand each of the capabilities and how the proposed solution stacks up.
- Document formats: What export formats does the solution support? What is the level of effort required to perform exports?
- Report design: How are reports designed, and where? Who has the ability to design reports? Are there any formatting limitations? How challenging is it for the average business user to design a report?
- Scalability: What scalability expectations should you have of the solution? How quickly are reports executed? What are the available performance parameters to tune?
- Self-service reporting: Can end-users, customers, or staff create their own reports without the need for additional support or administrator level privileges? What level of autonomy does the solution provide end users?
- Ad-hoc reporting: Is it possible to create reports on the fly? Can ad-hoc reports be driven by an API? Can reporting templates be created on the fly?
- Scheduling: Does the solution offer scheduling? What intervals are available? Can reports be kicked off in response to events in other systems?
- Customer portal: How do downstream report consumers access reports? Does the solution offer a portal for report viewers? Can the portal be white-labeled or customized?
- Extensibility: Customization has its limitations. What capabilities are available for developers to extend the solution and embed its capabilities in other applications?
- Data security: What access control capabilities does the solution offer? How are reports filtered for different audiences? Does the solution allow you to inherit Qlik Sense section access rules?
- Governance and process management: Managing execution and delivery of tens of thousands of data-driven documents is complicated. What capabilities does the solution have to oversee bulk processes, and respond to errors or anomalies? Are audit logs generated? How are users and access control managed?
Qlik Sense Built-In Reporting Capabilities
Qlik Sense offers built in features to address export requirements. What’s great about these is that they don’t require any additional software, but do note that they are quite limited.
If all you need is a simple one-off image, PDF, or CSV of a chart or table, Qlik Sense’s built in capabilities may be useful to you.
Document formats
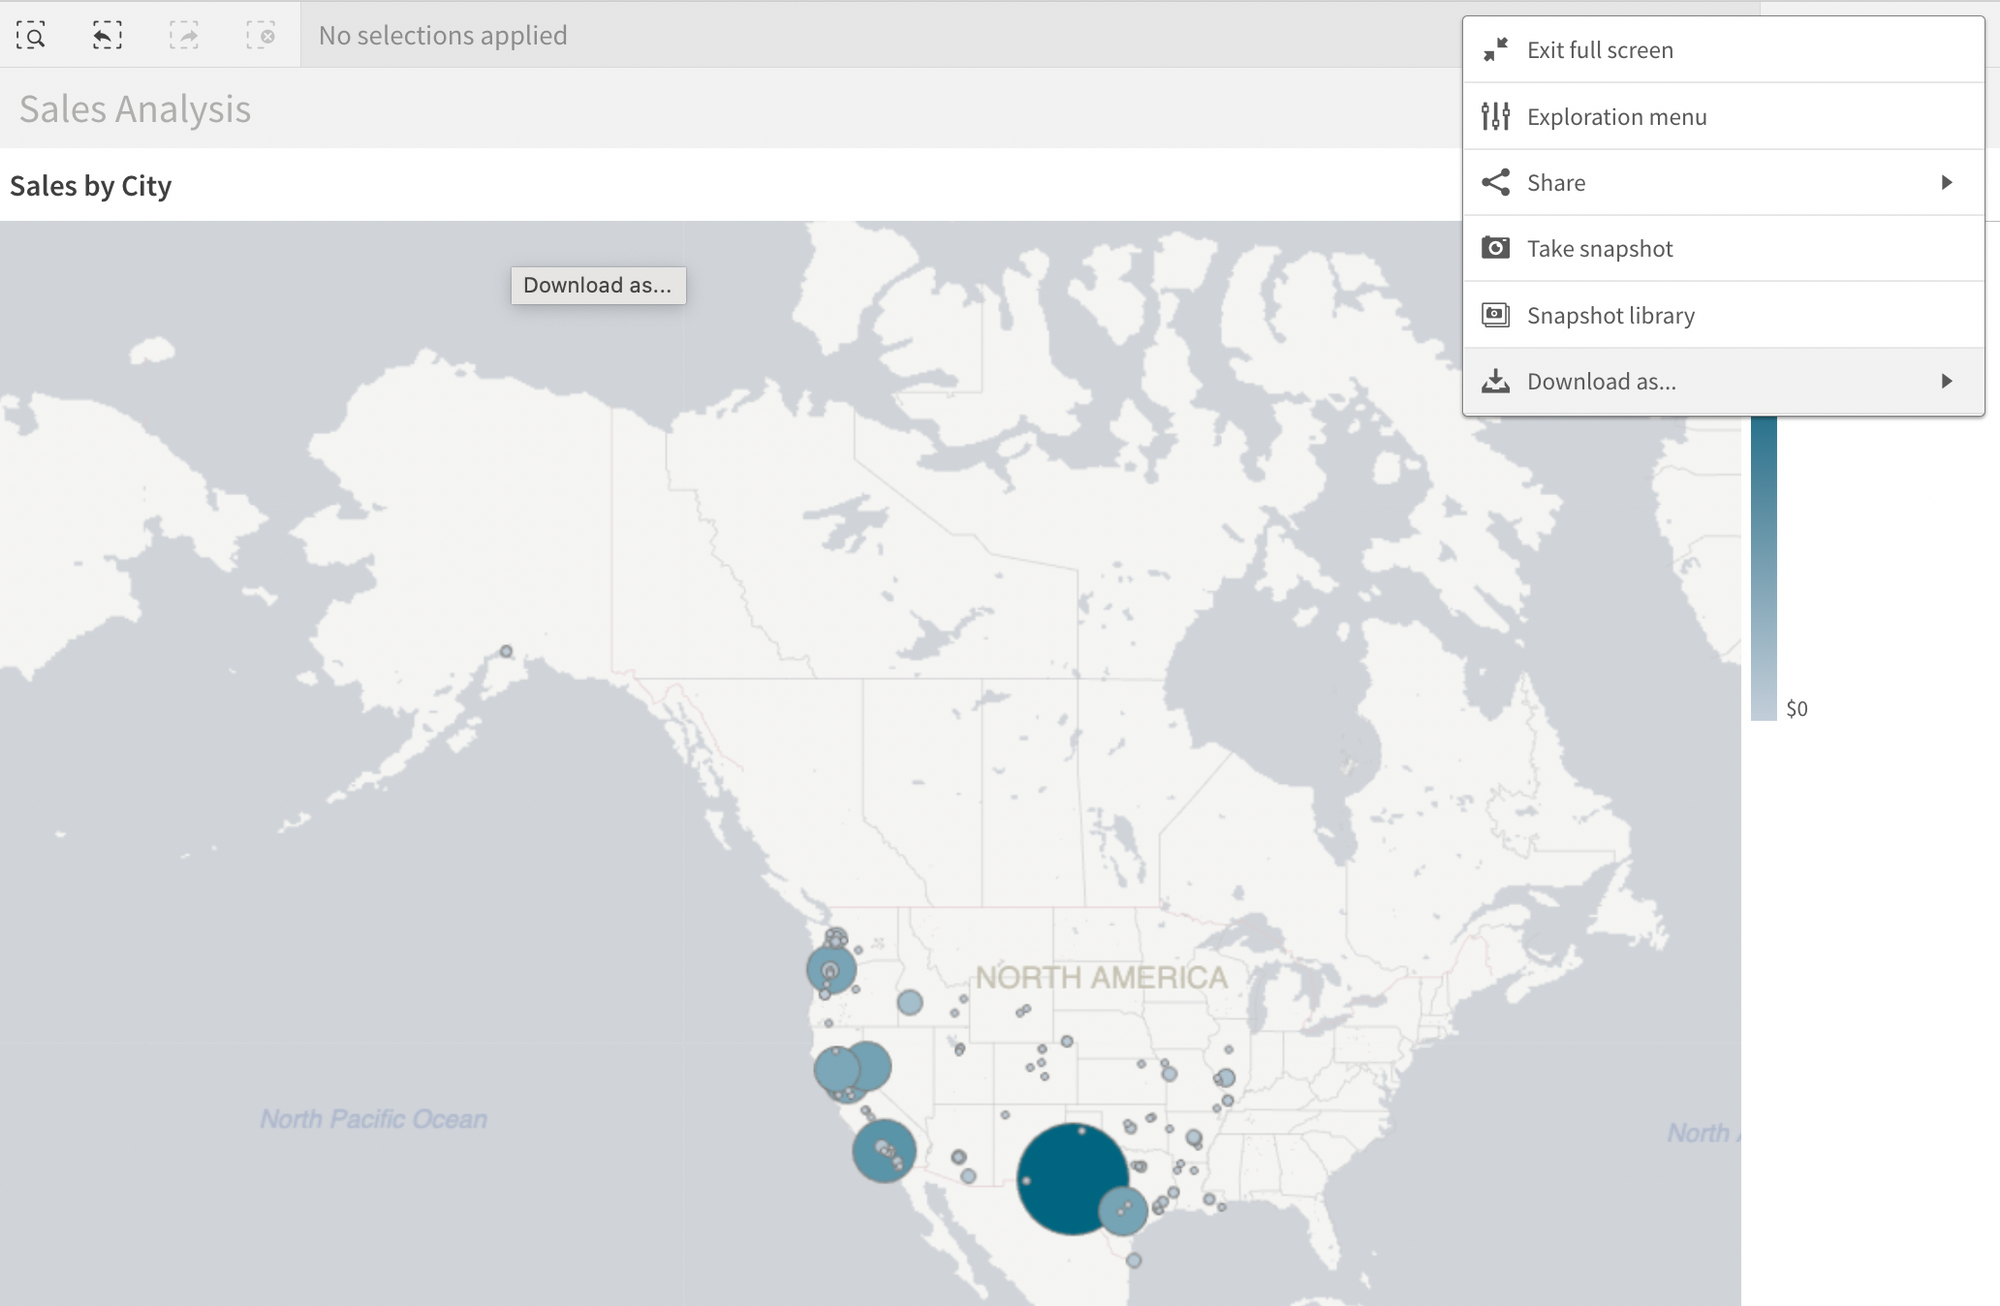
Qlik Sense has the built in ability to export a given visualization or chart on a sheet as an image or PDF. There several limitations here:
- Only supports single objects: You cannot export an entire dashboard
- No publicly documented API: This feature is only available through the Qlik Sense UI, so it cannot be automated
Additionally, you can download the underlying data for a table or pivot table as CSV directly from a Qlik Sense dashboard. This is also only available through the Qlik Sense UI, and therefore cannot be automated through APIs or used in your external applications.
In terms of the other 9 capabilities, Qlik Sense's out of the box features do not really cover these. If all you need is exports, Qlik Sense may fit the bill, but for advanced static reporting use cases, you will need to look to other solutions.
Qlik NPrinting Reporting Capabilities
Qlik NPrinting serves a wide variety of enterprise reporting use-cases, but requires significant configuration, specialized knowledge, and integration. Qlik NPrinting is designed for centralized reporting scenarios where it is acceptable for report design to only be available to report developer staff — it does not offer self-service report design capabilities.
Other limitations of NPrinting:
- Extensibility with NPrinting is limited. NPrinting APIs are primarily only designed to run on demand report generation requests. You cannot manage or create report templates from the APIs, schedule, or distribute to a customer portal.
- NPrinting also has limited ad-hoc reporting capabilities. If you need to dynamically create reports on-the-fly, NPrinting may not be the right solution.
- NPrinting’s template editor is not self-service. It is designed for advanced report developers and depends on Windows-based desktop software.
- Being a Qlik product, NPrinting only supports Qlik Sense and Qlik View as data sources. If you need to combine data from other sources in your reports, or potentially change your data source in the future, your reports are tied to Qlik.
Document formats
NPrinting allows you to deliver reports in many different formats including PDF, Word, PowerPoint, and Excel. Once a particular format for a report is chosen, however, it cannot be changed. This means that assets from Excel reports for example, are not usable in PowerPoint reports.
Report design
NPrinting offers several different ways to design reports. All reports design formats use the NPrinting template editor, which is desktop software. Report design is restricted to users who have installed the NPrinting desktop software and the NPrinting Developer role.
Overall, the NPrinting report designer is designed for advanced users and does not provide high levels of visual feedback. In many scenarios, templates contain code and it can be hard to understand what the final report will look like without running it.
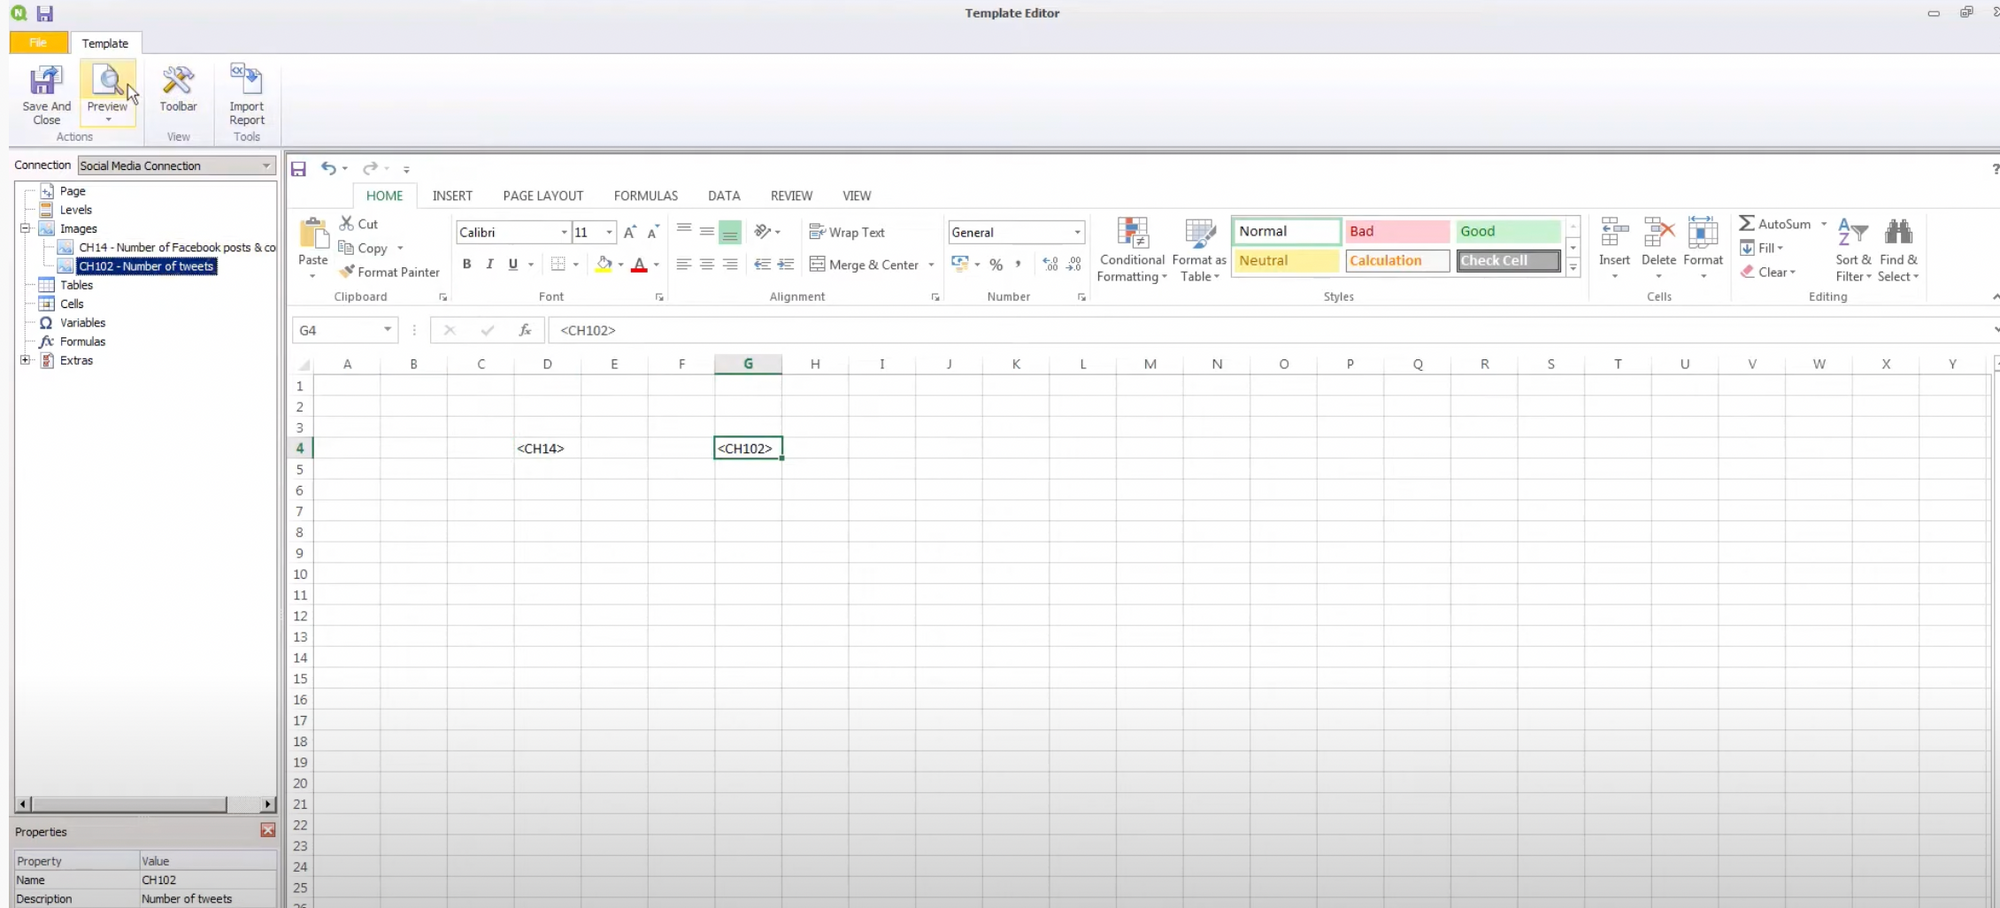
NPrinting implements concepts of cycling, called Levels, that allow you to iterate through data and create sections in your reports pertaining to the level. When designing in the embedded Microsoft editors, you have all of the formatting capabilities available in the associated Microsoft software.
Scalability
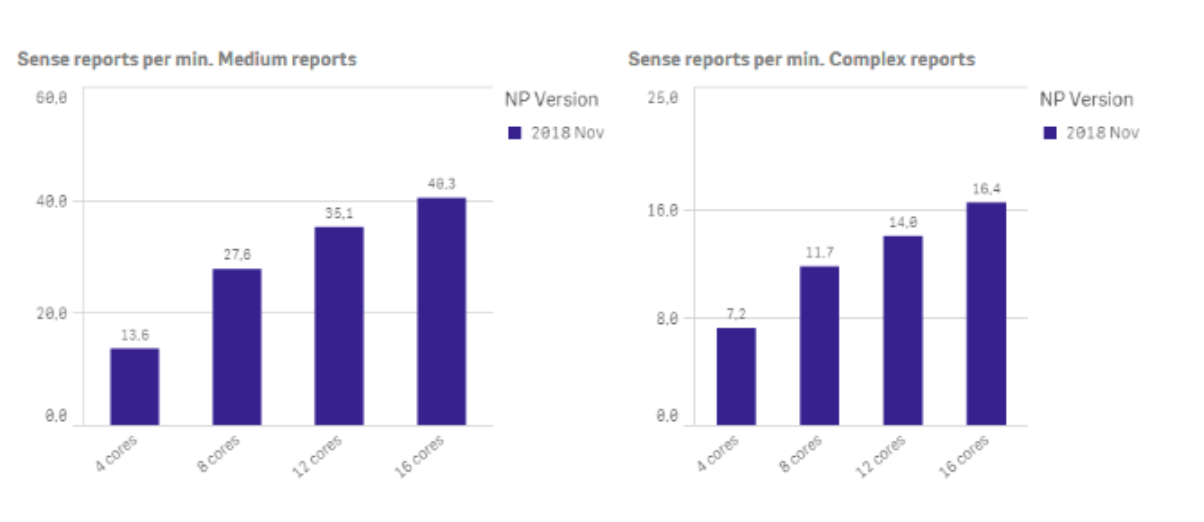
NPrinting 20 improved the scalability of NPrinting. According to Qlik’s benchmarks, NPrinting is capable of generating up to 40 reports per minute for a medium report on a 16-core server, and 13 reports per minute on a 4-core server. This close to linear scalability, but not quite.
Some of NPrinting’s scalability limitations come from the fact that is automates Microsoft office under the hood, which is not recommended by Microsoft:
Microsoft does not currently recommend, and does not support, Automation of Microsoft Office applications from any unattended, non-interactive client application or component (including ASP, ASP.NET, DCOM, and NT Services), because Office may exhibit unstable behavior and/or deadlock when Office is run in this environment.
Other solutions, such as ConnectReport, do not depend on automating Microsoft Office software and therefore achieve better stability.
Self-service reporting
Report design in NPrinting requires specialized expertise of NPrinting report development, and the NPrinting desktop software. Users who design reports must have the Developer role. NPrinting does not allow casual business users to create ad-hoc reports — reports are usually designed by the analytics team and changes require requests to the team managing reporting. For this reason, NPrinting is not a self-service reporting tool.
Ad-hoc reporting
Ad-hoc reporting generally allows users to pick specific columns or fields of a table, set some filter parameters, and get back a final document, perhaps in PDF or Excel. NPrinting does not support ad-hoc reporting. Templates must be created in the desktop NPrinting software and cannot be changed through APIs.
Report scheduling
NPrinting supports distribution schedules, which allows developers to deliver reports on a given schedule. Schedules can be Once, Daily, Weekly, Monthly, or Annually, or immediately.
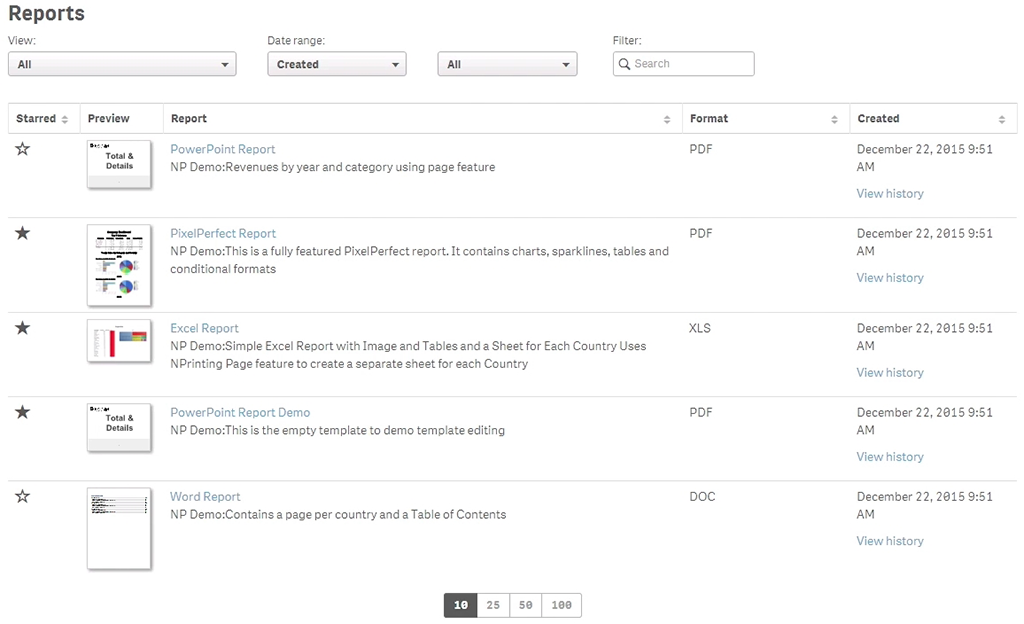
Customer portal
NPrinting offers NewsStand, a web portal where users can preview and download reports.
NPrinting does not support webhooks or APIs to download previously published reports, so it is not possible to automatically retrieve scheduled reports and place them in external destinations such as OneDrive or Google Drive.
Extensibility
NPrinting offers APIs that primarily allow you to manage and create on demand tasks. On-demand tasks result in a single report output, which can be downloaded by the user who created the task. NPrinting APIs do not allow you to schedule tasks, publish reports to specific users or a portal, or create / manage templates on the fly. Overall, NPrinting’s extensibility features are limited if you need to drive it from APIs or embed its capabilities in your application.
Data security
As of NPrinting 20, NPrinting has the ability to inherit your Qlik Sense section access. It also offers role-based access control on top of this, to support access control within the NPrinting platform. NPrinting’s access control allows you to create fine-grained custom roles.
Governance and process management
NPrinting provides audit logging to allow you to trace who generated reports and when, authentication events, and more.
For task management, NPrinting offers a console to review task executions, but does not allow you to filter tasks by author, frequency, or start time parameters. It is also not possible to export the task execution table to CSV. NPrinting’s report allow you to abort tasks.
Qlik NPrinting Pricing and License Model
NPrinting is priced per engine, with an SMB tier and an unlimited tier. The SMB tier is limited to around 250 named recipient users and 2 developers, whereas the unlimited tier has no named recipient limitation. The unlimited tier has a base cost of around $30K USD and around $20K per additional engine. Additional engines allow you to scale NPrinting up.
ConnectReport Qlik Sense Reporting Capabilities
ConnectReport serves complex enterprise reporting use cases, without requiring users to have specialized technical knowledge or comfort with code. The upfront integration effort of ConnectReport is small, but it’s extensive and APIs and extensibility allow you to deeply integrate it with your applications.
Overall, ConnectReport is priced at a tier that may be too high for smaller internal use-cases, but if you are considering it as an alternative to products like NPrinting, it sticks out in a few areas:
- Self-service report design is possible with ConnectReport, due its web-based and user-friendly template editor. Reports do not require developers.
- You can drive nearly all of ConnectReport’s features through APIs, allowing for deep integrations with your applications and rich reporting experiences directly in your own platform.
- Scalability wise, ConnectReport is better suited for high load use cases due to its modern, efficient architecture.
- ConnectReport is vendor agnostic. If you decide to move your analytics to another data source, your static reports aren’t tied to the vendor.
Document exports
ConnectReport allows you to create templates for all supported formats without deciding the final export format upfront. It supports pixel-perfect exports to Excel, PowerPoint, PDF, and CSV.
Report design
ConnectReport offers a web-based template editor. Users with the Author role in ConnectReport can access the ConnectReport template editor from their web browser — there is no desktop software required. ConnectReport supports tables, dimensions, expressions, visualizations and sheets from Qlik Sense.
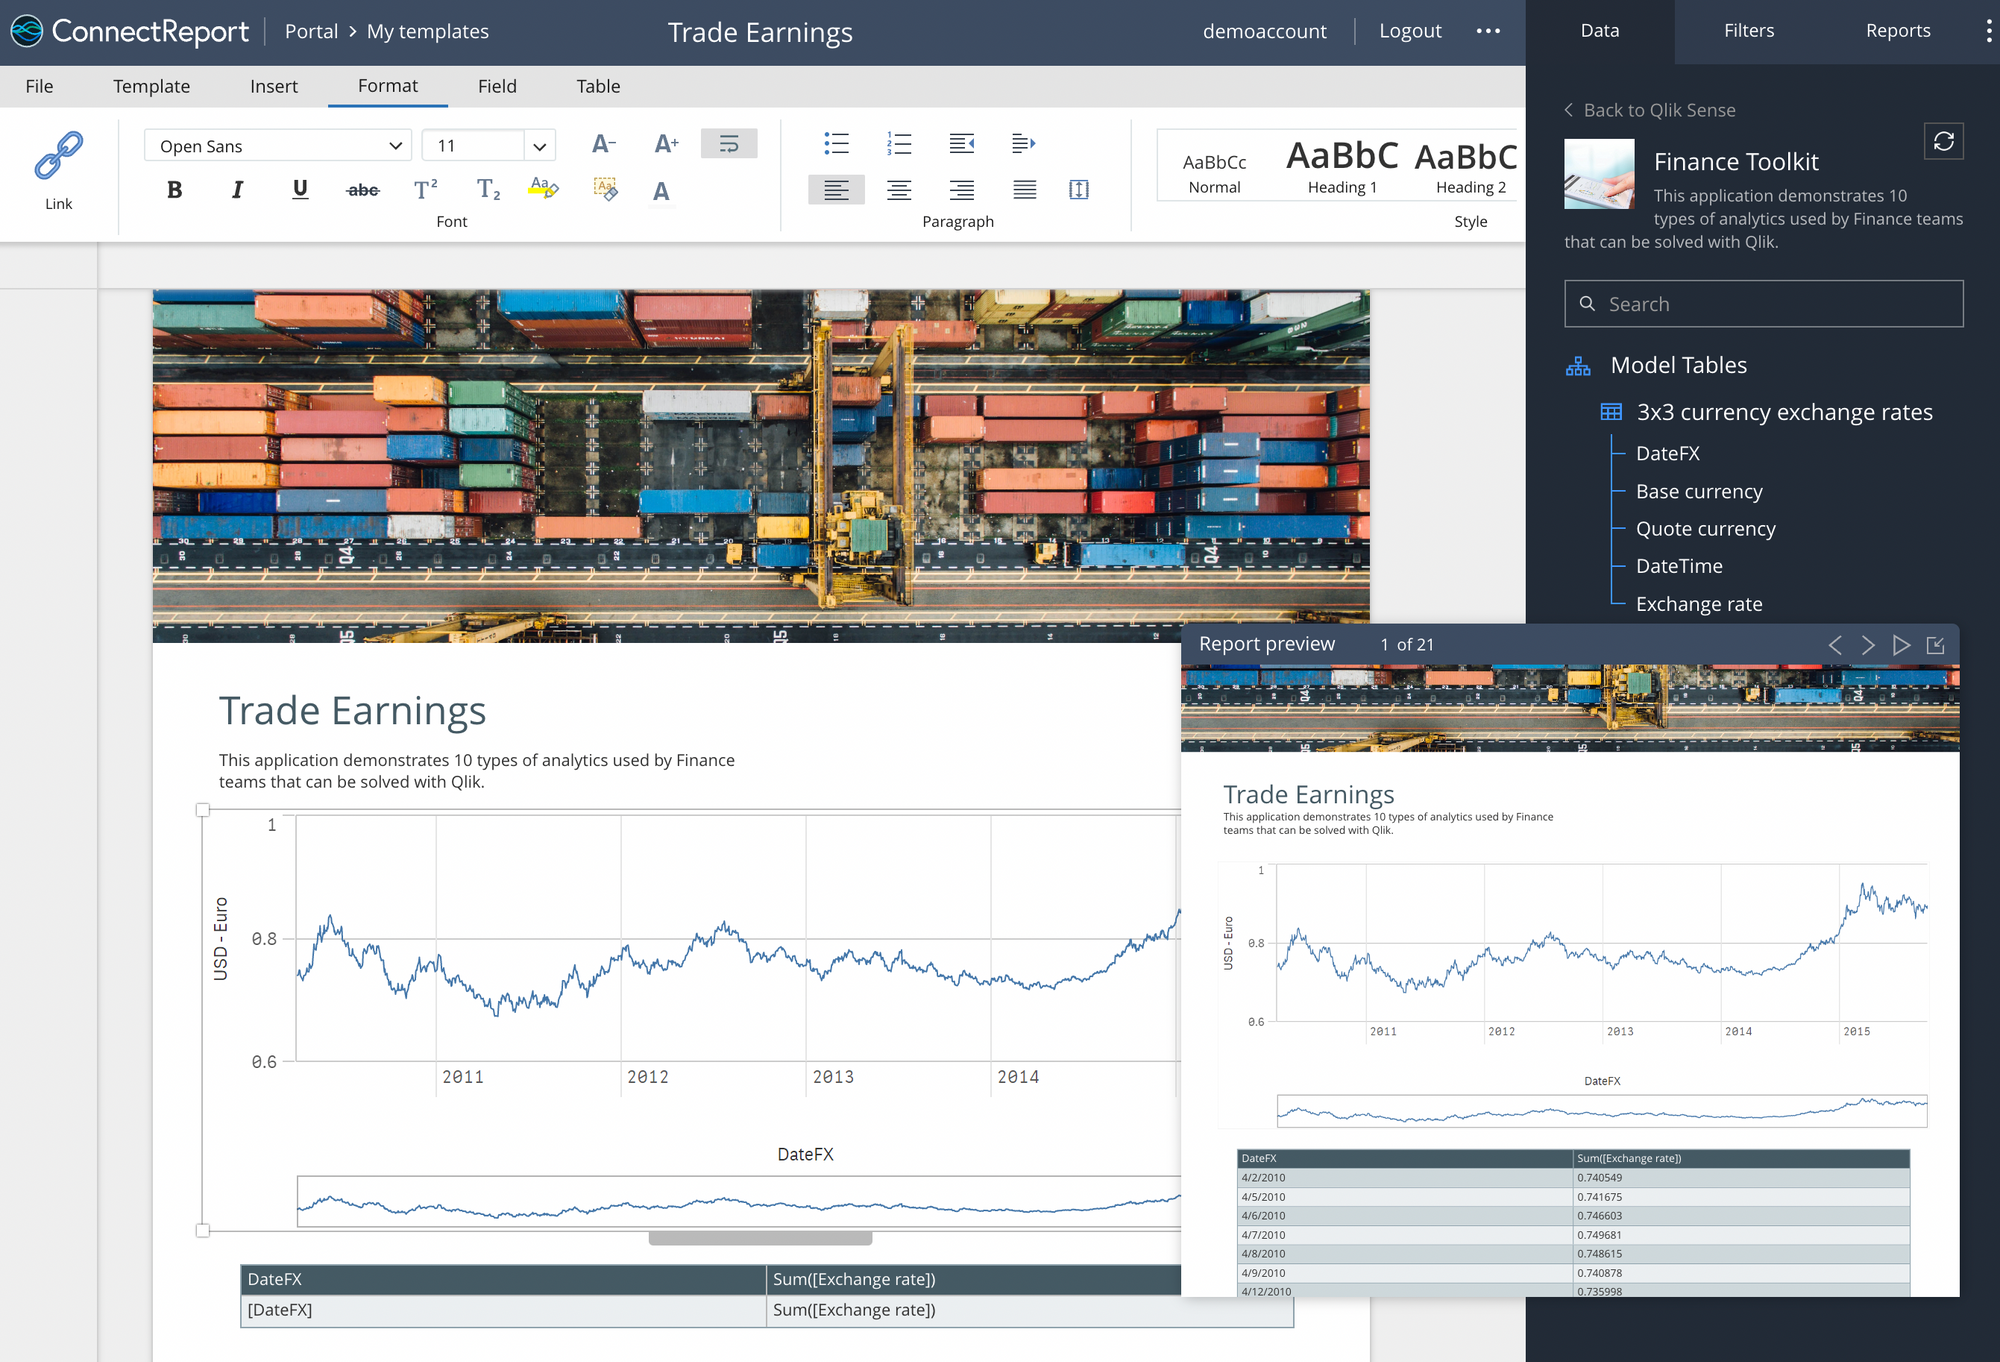
ConnectReport’s template editor is designed to allow casual business users to create reports without significant training. It also provides a live preview as authors build out reports for visual feedback.
The ConnectReport template editor provides advanced capabilities report design, including page cycling and table grouping, without depending on Windows-based desktop software or expert technical knowledge.
Scalability
ConnectReport scales very well, and is capable of generating up to 90 reports per minute for a medium report on a 16-core server, and 15 reports per minute on a 4-core server. ConnectReport has extensive tuning options to control report and visualization concurrency, timeouts, and number of workers.
Self-service reporting
ConnectReport is designed to facilitate self-service reporting scenarios. Instead of a centralized model where reports can only be created or modified by advanced users on a reporting or IT team, ConnectReport compliments self-service BI, allowing anyone comfortable working with a tool like Qlik Sense to also create and distribute documents on Qlik Sense data. Because ConnectReport is entirely web based, there is no need to install and manage desktop software to support authoring. ConnectReport’s template editor allows casual business users to quickly build documents on BI data without extensive training or code.
Ad-hoc reporting
Ad-hoc reporting allows users to create reports on the fly, by specifying fields, filters and other parameters relevant to their intended output. Both through its web-based template editor and its APIs, ConnectReport allows users to create templates from on the-fly. From the template editor, users can quickly pull down the analytics they need into a document. Alternatively, ConnectReport’s APIs can be used to power document generation.
Because ConnectReport’s templates utilize HTML rather than a closed source format under the hood, it is possible to programmatically generate or modify templates according to user criteria set in an external application. This has allowed organizations to allow users to create ad-hoc reports by picking columns from a picklist within a line-of-business application, for example.
Report scheduling
ConnectReport supports scheduled tasks, which allow users deliver reports on a given schedule. Schedules can be Once, Daily, Weekly, Monthly, or Annually, or immediately.
Customer portal
ConnectReport provides a report portal where users can navigate to retrieve reports that have been shared with them. The portal provides search, tagging, and the ability to view and download reports.
In addition to the portal, ConnectReport allows you to distribute reports to other destinations, such as Google Drive or OneDrive, through its webhooks and APIs.
Extensibility
ConnectReport allows you to utilize nearly all of the APIs that power its product in your own applications, including creating report tasks, scheduling tasks, downloading generated reports, running on-demand tasks, managing users, and creating templates.
ConnectReport’s APIs make it possible to run ad-hoc reports, expose scheduling capabilities in your applications, and bring lots of flexibility in terms of external system integration and embedded use cases. Overall, ConnectReport’s API capabilities are powerful.
In addition to APIs, ConnectReport also offers “callbacks” — also known as webhooks — which can be used to respond to events happening within its system, including before and after a report task executes. You can use these to create custom behaviors, such as sending a user notification via a Slack message after a report published, or preventing a task from running if certain conditions aren’t met.
Data security
ConnectReport inherits your Qlik Sense section access. In addition, it also has its own role-based access control enabling you to control which users can access templates, view reports, and perform administrative activities. ConnectReport’s access control allows you to create fine-grained custom roles as well.
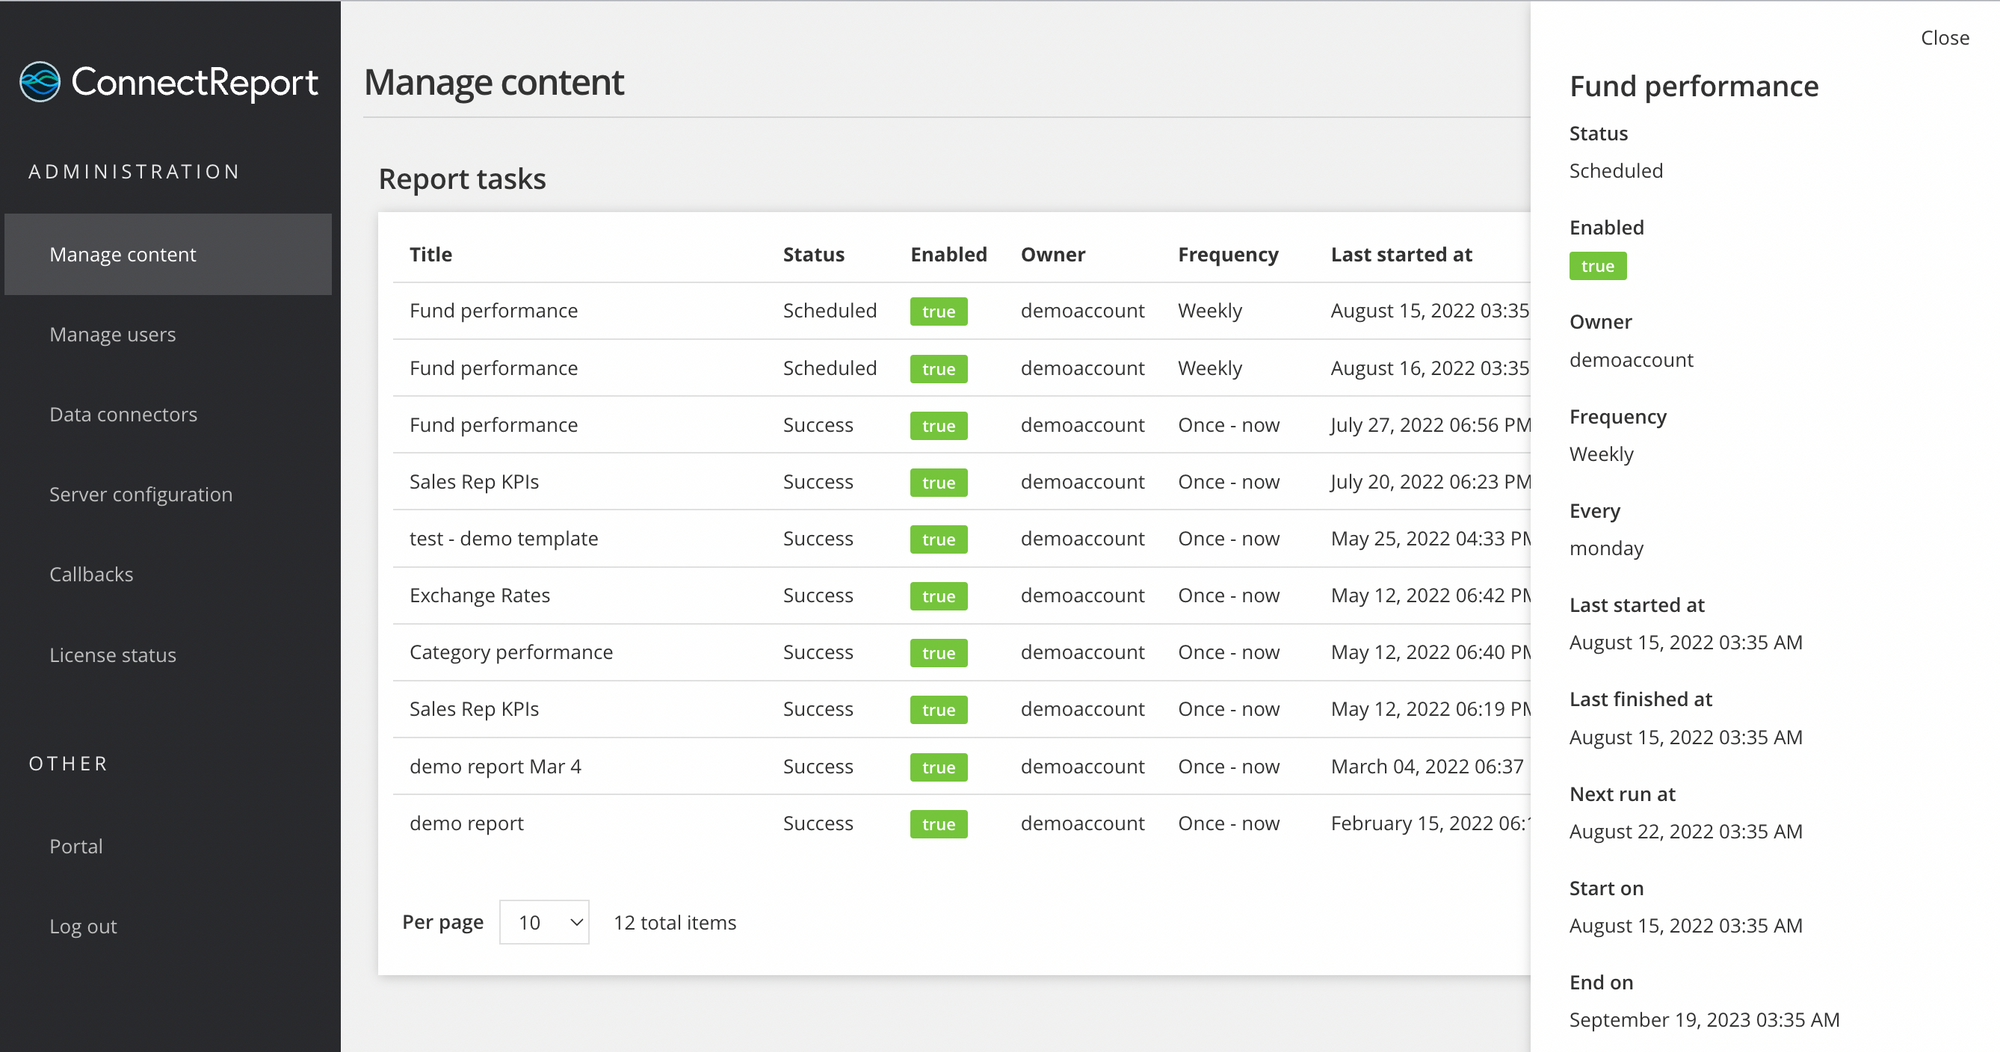
Governance and process management
ConnectReport provides audit logging for all activities. Audit logs allow you to trace who ran particular report and when, authentication events, and more.
For task management, ConnectReport offers a console to review task executions, and find and triage any failures. It also allows you to filter tasks by owner, frequency, start time, end time, status, and other parameters. It is possible to export the report task list to CSV. Overall, ConnectReport’s task management has solid task management fit for managing even very large workloads.
ConnectReport Pricing and License Model
ConnectReport is priced either per-user or per-CPU core. The starting tier allows you to utilize unlimited cores for up up 25 users. In the per core model, you get unlimited users and reports, and there is a base fee as well as a cost for each additional 4 CPU cores.
Summary
There are several great reporting solutions available for Qlik Sense, each with its own strengths and weaknesses across the 10 key capabilities. Qlik Sense’s built-in reporting capabilities are limited but do not require any additional software. Qlik NPrinting is designed for centralized reporting scenarios where it is acceptable for report design to only be available to report developer staff. ConnectReport is the vendor agnostic solution that serves complex enterprise reporting use cases, without requiring users to have specialized technical knowledge or comfort with code. The upfront integration effort of ConnectReport is small, but it’s extensive and APIs and extensibility allow you to deeply integrate it with your applications.