Working with pivot tables
Supported data sources: Qlik Sense
Pivot tables allow you to summarize and aggregate data in unique ways to highlight desired information for your report audience. ConnectReport supports pivot tables for Qlik Sense data connections.
Insert a pivot table
- From the data connection sidebar, under Components, drag and drop a Pivot Table into the editor stage.
- Drag the dimensions into the desired position. If you want the dimensions to present as rows, drag them into the left column of the pivot table. If you want the dimensions to present as columns, drag them into the top of the pivot table.
- Drag the measures into the values section
Note that a pivot table must contain at least one measure (“value”) and at least one dimension.
Aggregate measures as rows in a pivot table
The “Values” box in the pivot table component can be dragged from the columns section to the rows section if desired. This allows you to have measures aggregated by the left side of the pivot table.
Toggle indenting of rows in a pivot table
You can optionally make pivot table non-indented. By default, pivot table are indented, meaning that nested rows in the pivot table are indented. For example, if you have “‘Year” and “Project” in the left side of the pivot table, values for “Project” will be indented below each year.
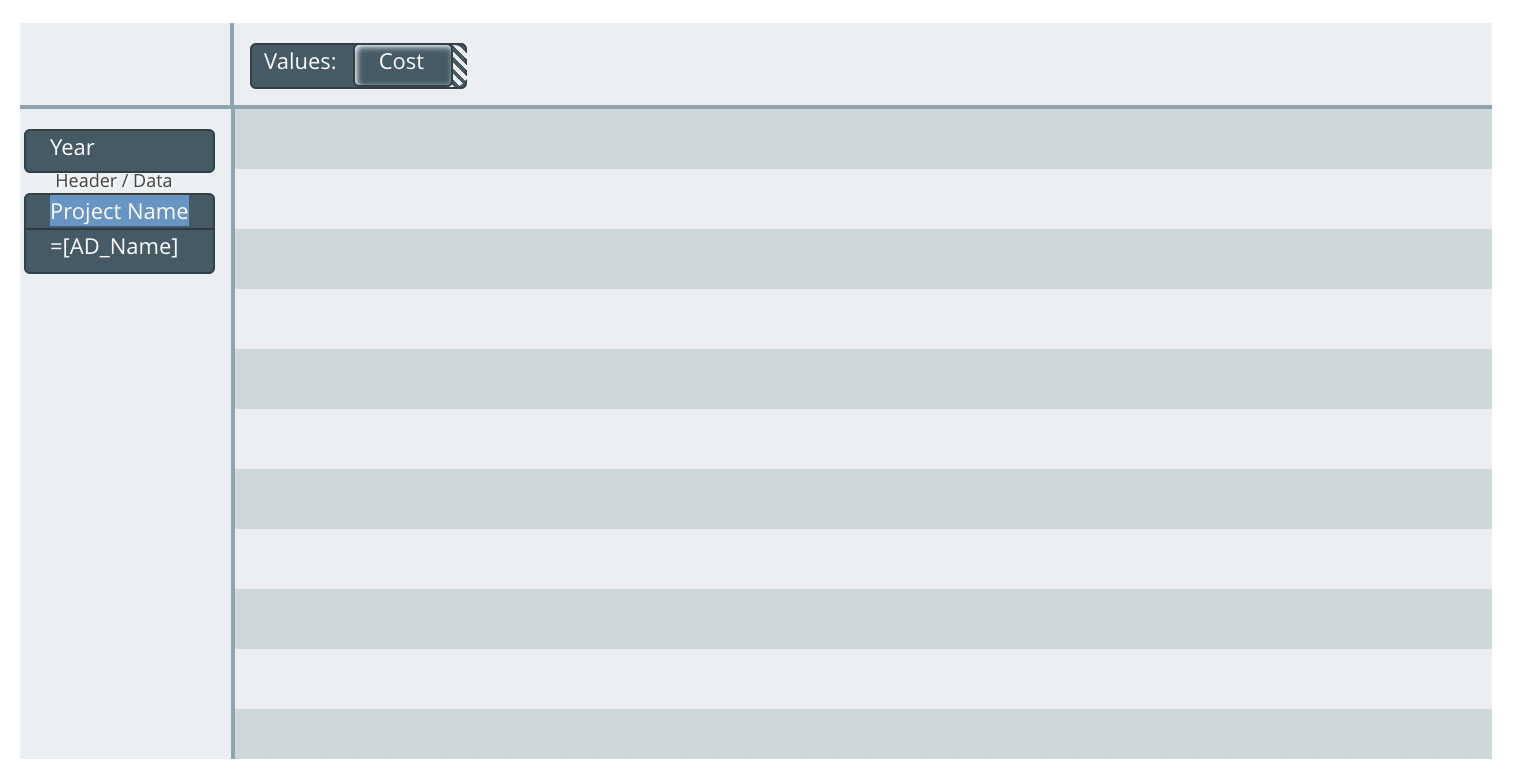
Template input:
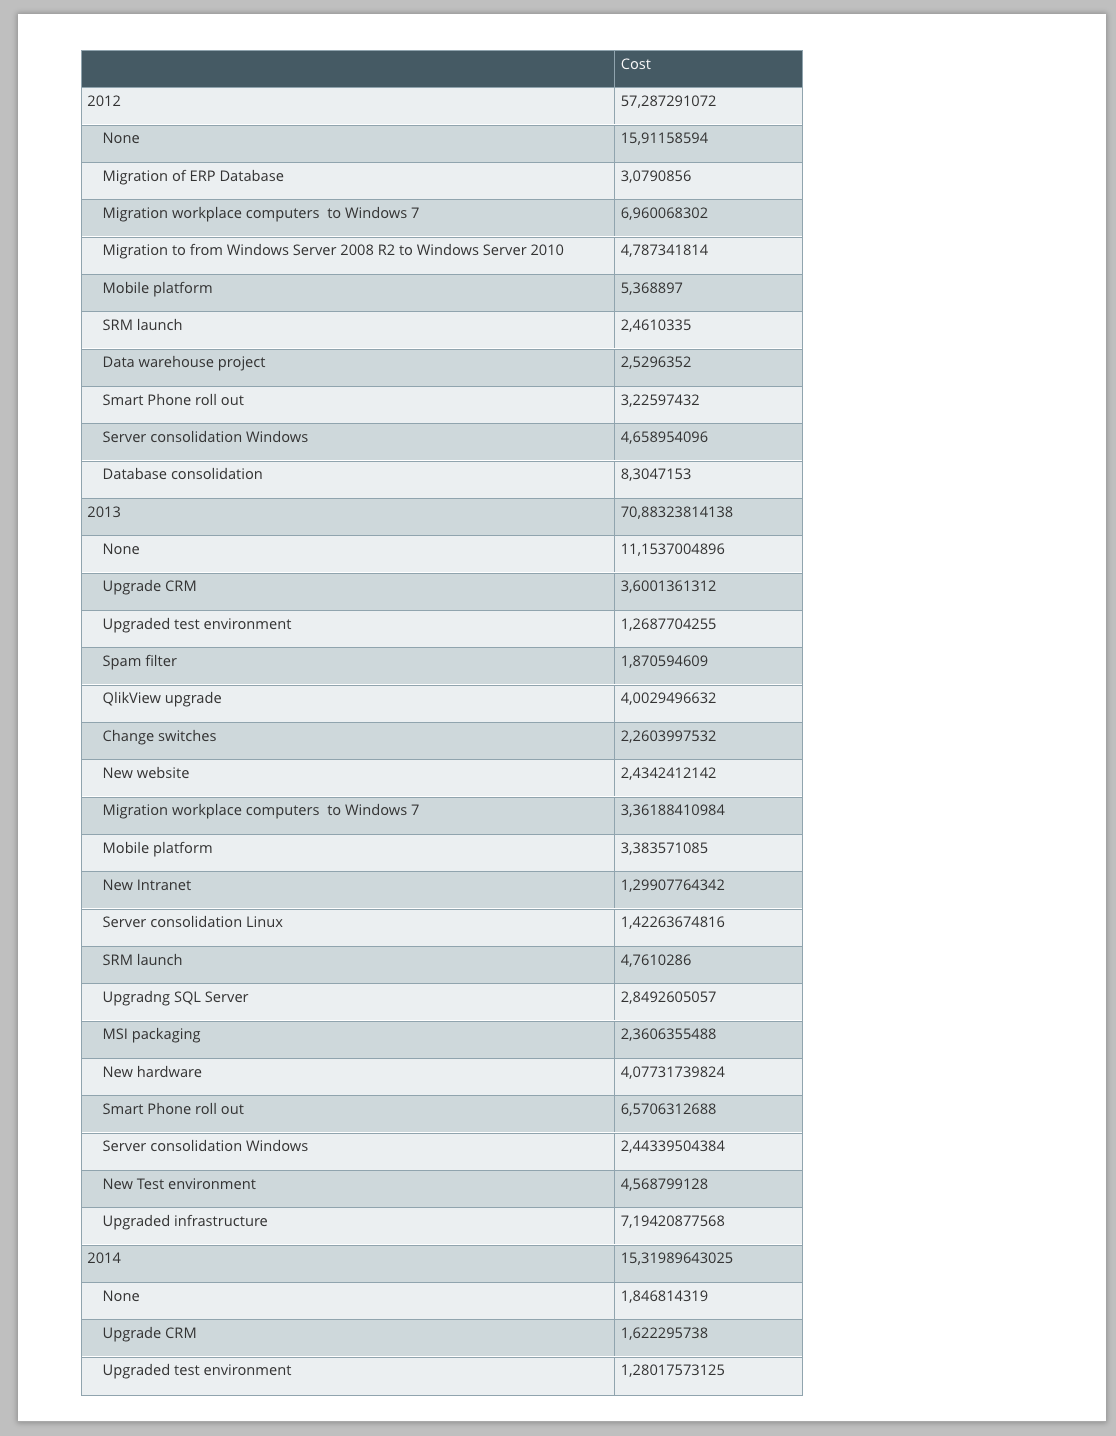
Output, indented:
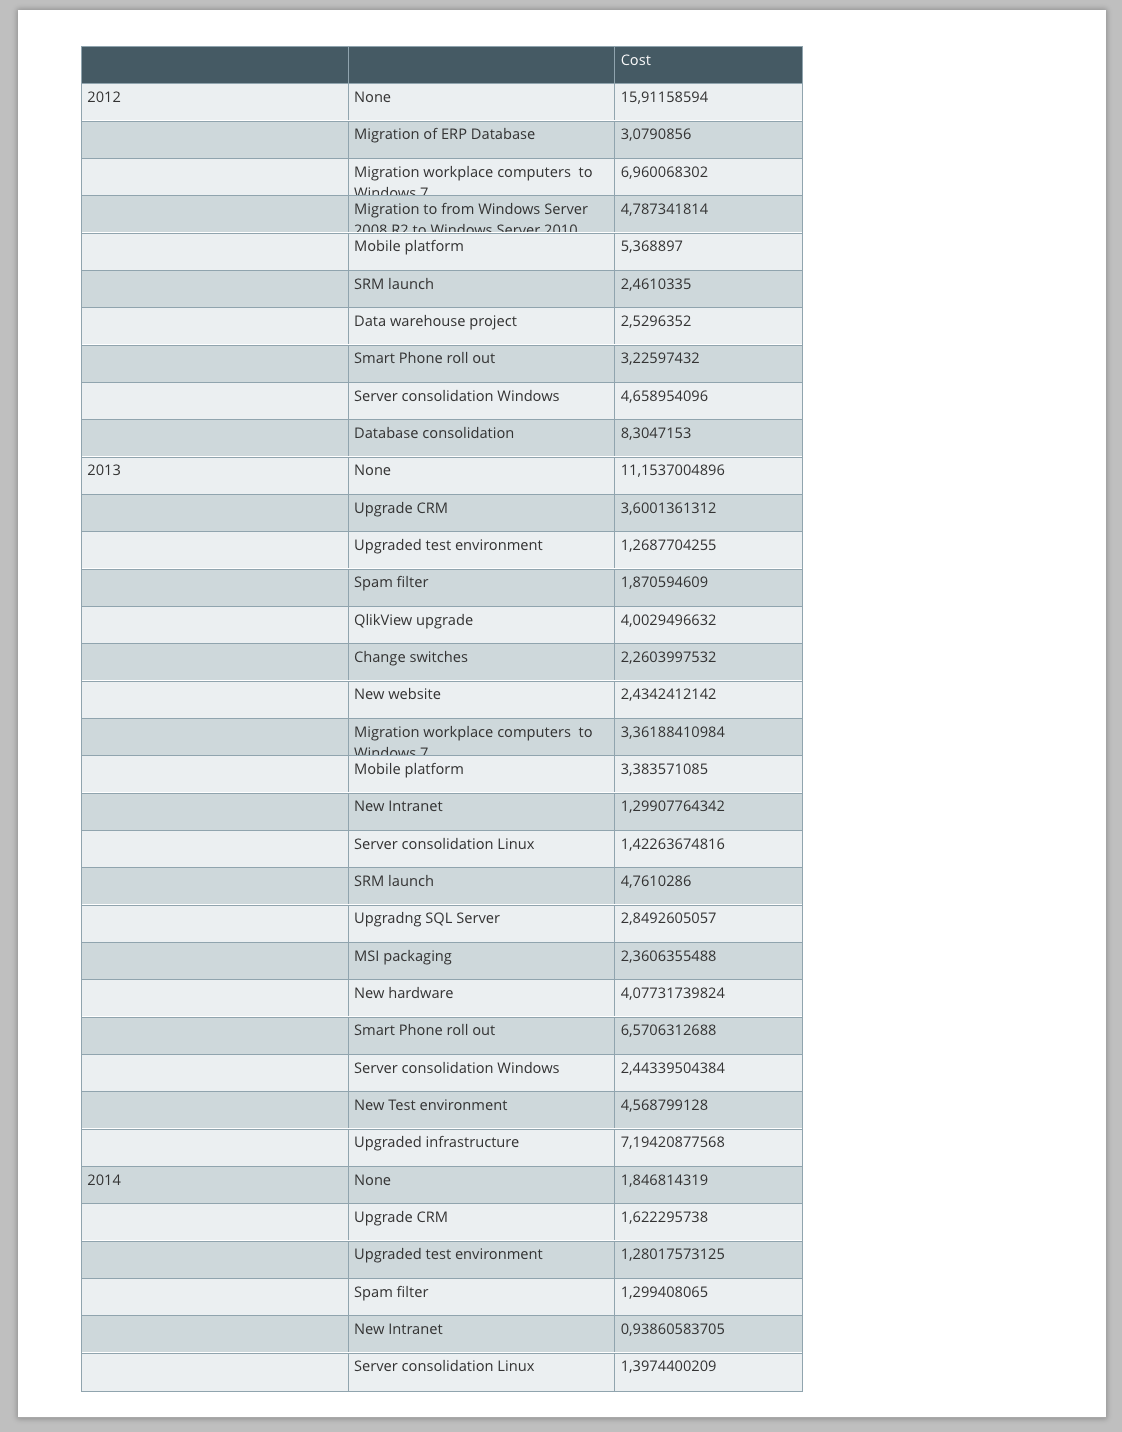
Output, non-indented:
To toggle indenting in a pivot table, do the following:
- Select the pivot table in the editor stage
- Within the ribbon menu navigation, click Table
- Set Indent rows to the desired value (“True” or “False”)