Getting started with tables
Tables in ConnectReport are powerful template components that allow you to build paginated data output.
Insert a table
There are several ways to insert a table into the editor stage. From a given data source, you may drag in a specific field (dimension or measure), or an entire table onto a template page. Using the live preview, you can quickly view the output of the table.
Format a table
To format a table:
- Locate and click on the table in the editor stage that you would like to format. The currently selected table is highlighted is blue. When a table is currently selected, the editor ribbon navigation will contain a navigation entry for Table.
- Click Table in the editor ribbon menu navigation
Format table colors
Within the table ribbon menu, there are several built-in table formatting color schemes available. You may click one of the built in color schemes to format the table. Alternatively, you can format the Background color, Border color, Alternate background color, Header background color, and Border style as needed.
Format table height
You can also control the row limitation of a given table. The default height limitation is 1000 rows. If you need to print more than this in your report, you can configure this as needed. There is no preset upper limit to this
Center content in a table
To make data and header content in the final table output vertically centered, set Center content to True.
Control totals positions
If measure columns in the table contain totals, you can control the positioning of where the totals print by setting Totals positions. By default, this is Bottom; it may also be set to Top.
Control stacking
Tables with stacking enabled (“Stacked tables”) push content below them down in the template output.
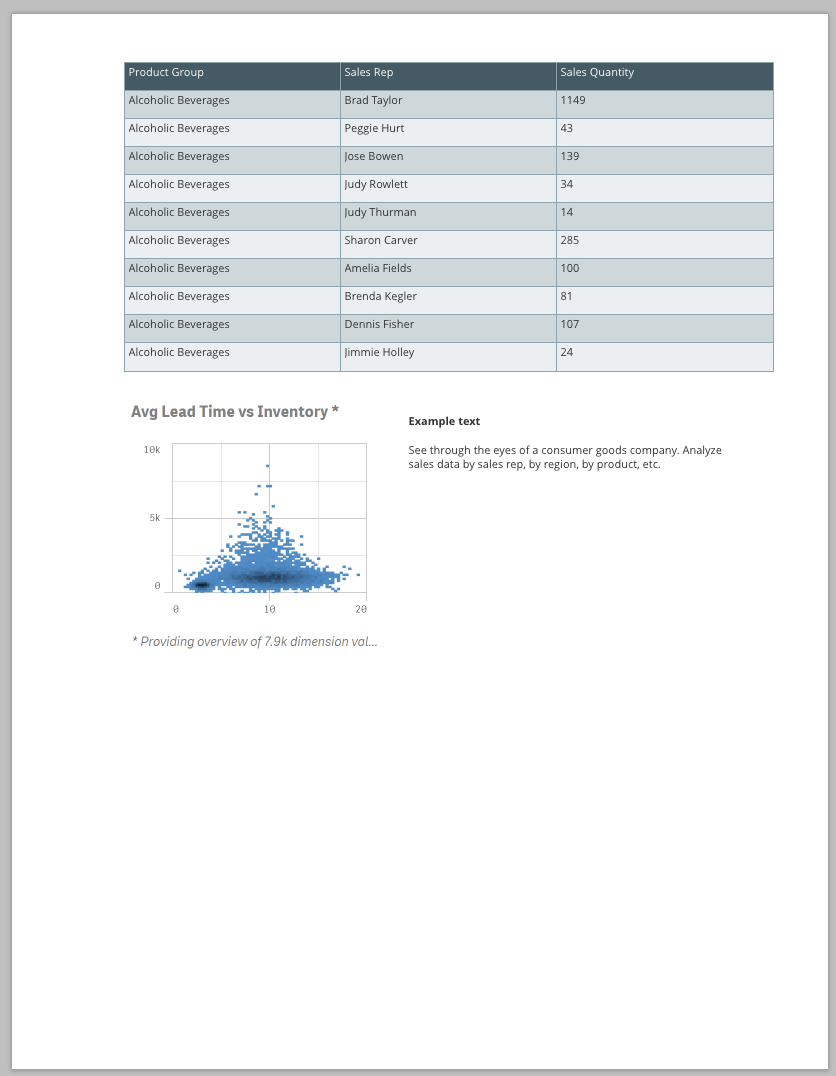
For example, imagine that a template page contains a table at the top, with a visualization and a text box component below the table.
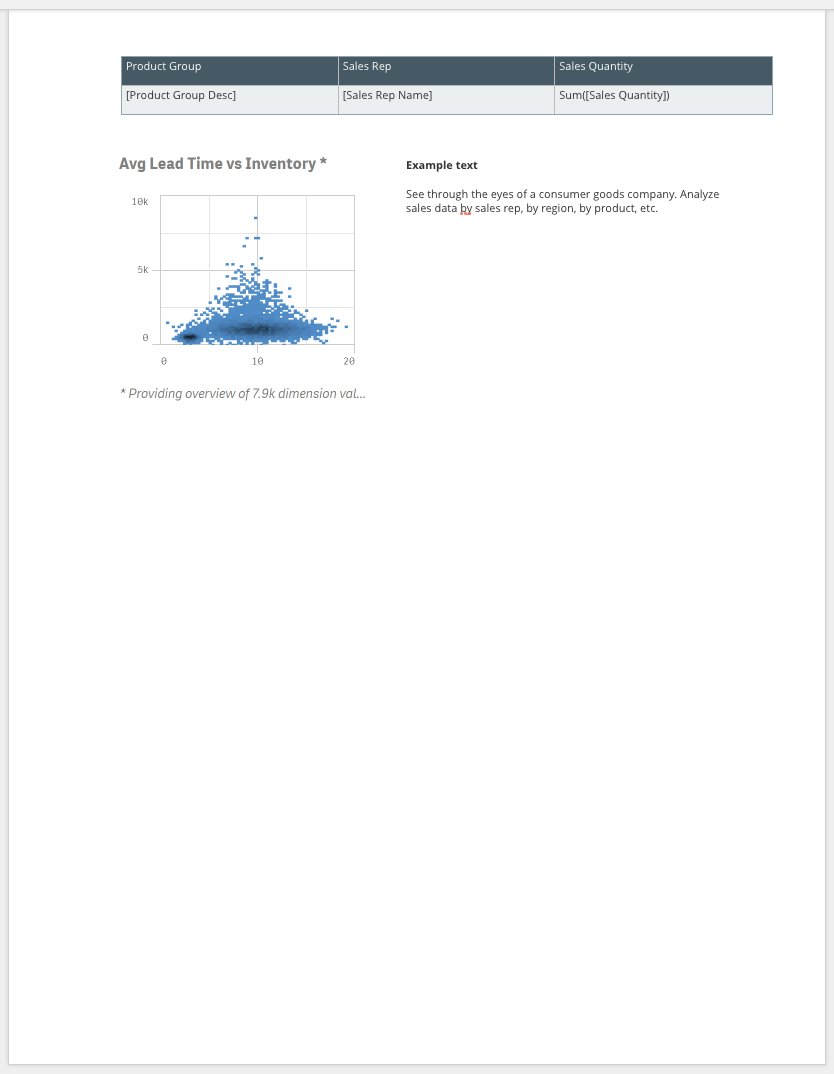
If the table has Stacked table set to True, the visualization and text box will appear below the final row of the table in the rendered output, as below.
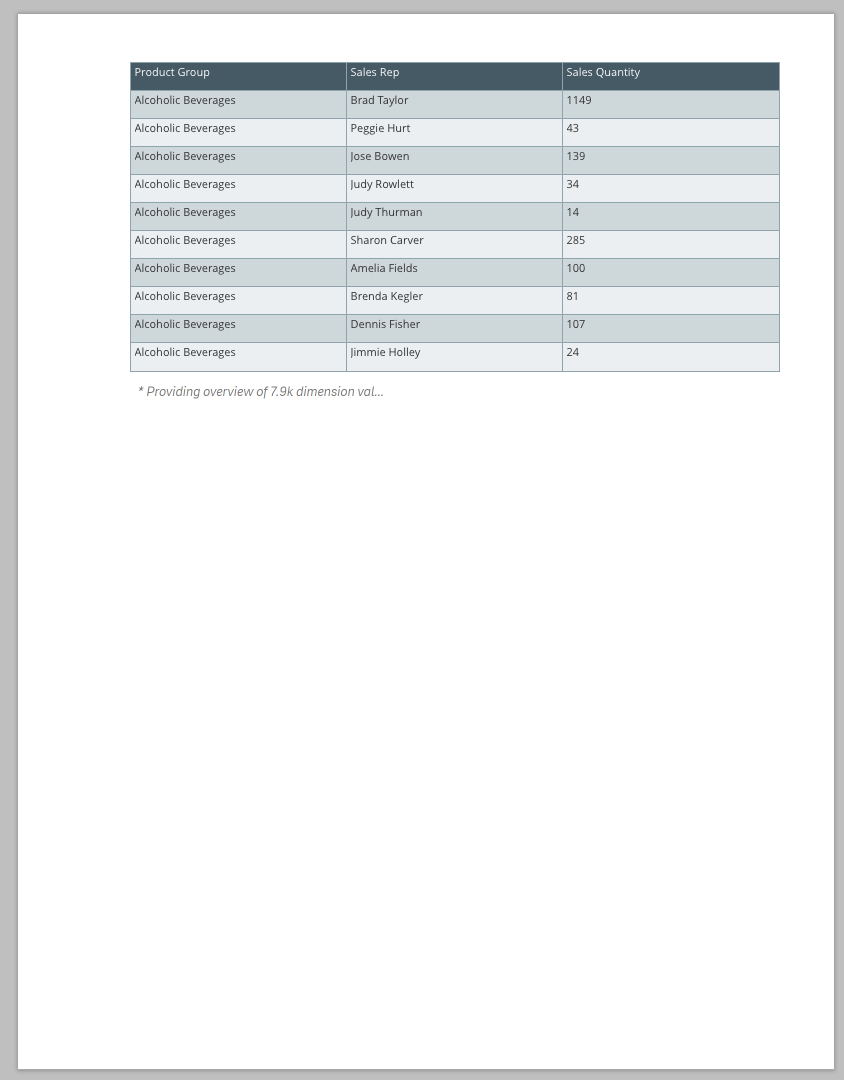
If Stacked table is set to False, the printed table rows will overlap the text box and visualization.
Reorder columns in a table
To order columns in a table:
- Click on the table
- While a table is selected, you can drag any of the column gutters at the top of the template editor stage (labeled as “A”, “B”, “C”, “D”, and so on) to reorder the columns of the table
Resize table header and data height
For more precise control:
- Click on the table
- With the table selected, navigate to the component properties menu. To navigate to the component properties menu, click the three dots on the right of the sidebar navigation, and click Component properties
- Within the component properties menu, you can alter the pixel value of Header height and Data height
Alternatively, for fast control over table resize table header height:
- Click on the table
- With the table selected, header and data gutters on the left of the template editor stage will appear. You can drag the bottom of the header gutter to resize the header.
Resize table columns
To resize table column widths:
- Click on the table
- With the table selected, columnar gutters at the top of the template editorstage will appear, listed as “A”, “B”, “C”, “D”, and so on.
You can drag between any of the columnar gutters to resize the width of the columns in the table.
Resize an entire table
To resize an entire table:
- Click on the table
- With the table selected, you can click any of the resize handles in the corners of the table to resize it.
Set column sort order for a table
When sorting fields in a table, you may wish to sort the fields in an order that differs from the order they appear in the table. For example, your table may contain the columns “Year” and “Budget” from left to right; however, you may wish for the data to be sorted by budget. When connected to Qlik Sense data connections, you have the ability to control the order in which fields are sorted that is different from the displayed order of the columns using a feature called column sort order.
To set the column sort order:
- Click the table you wish to modify the column sort order for
- Right click on the blue table handle to open the table context menu
- From within the table context menu, click Column sort order
- From within the sort order overlay, click and drag the columns into the desired order.
- Click Close
Add rows to a table
If you wish to add summary-level information at the top or bottom of your table, or additional labels, you can use rows.