Working with data grids
Static tables allow you to arrange summary level information in a tabular format within your reports. Unlike regular tables in ConnectReport, where fields are repeated for every value in the data set, content from data connections (such as dimensions or measures) used in data grids is not repeated. If you want to display multiple KPIs, measures, or dimensions that are filtered down to a single value, data grids may be useful.
In addition to data grids, the template editor also allows you to add static rows to regular tables. Adding a static row to a regular table allows you to create a row with summary level data, totals, or static text at the top or bottom of your table.
Example
In the below example, a data grid has been added to the template. The first column of the data grid includes static text with labels for the values in the subsequent column, as does the third column. The second and fourth column include measures and dimensions that have been added to the data grid from a data connection.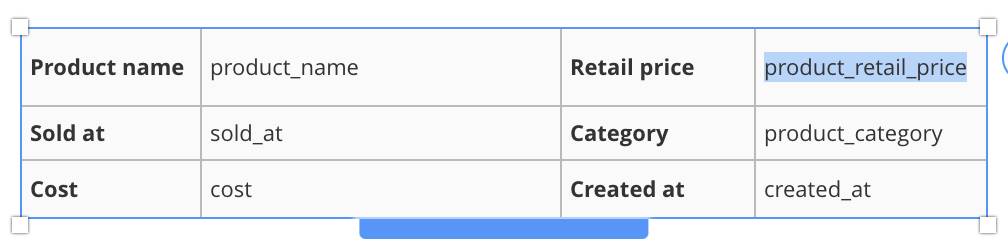
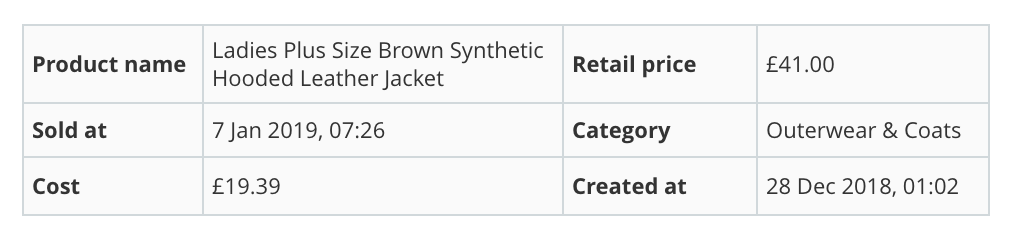
The data grid will render as follows in the below image. Note that the report has been filtered sufficiently to narrow down the product_name and product_category to a single product, resulting in the dimensions resolving with a single value. If a static column uses a dimension that is not sufficiently filtered, the dimension will return null and the column will display with a “-” as the value.
Insert a data grid
- From the template editor data sidebar, navigate to a data connection.
- Under Components, click and drag the Static Table component into a page of your template.
Add rows to a data grid
To add a row to a data grid, right-click on any field within the data grid, choose Add static row and select Top or Bottom. The row will be added to the top or the bottom of the data grid based on your selection.
Add columns to a data grid
To add a column to a data grid, right-click on any field within the data grid, choose Add static column and select Left or Right. The row will be added to the top or the left or the right of the existing field based on your selection.
Add grid rows to a regular table
To add a grid row to a regular table, right-click on a field within the table, choose Add static row and select Top or Bottom. The static row will be added to the top or the bottom of the existing table based on your selection.
Add dimensions or measures to a data grid
You can add fields such as dimensions or measures to a data grid column. Fields added to a data grid are treated like dynamic text, and are expected to resolve with one single value.
To add a field to a data grid, from a data connection within the data sidebar, click and drag a field into the static column.
Alternatively, you can also right-click on a static column, and choose Enable evaluation. This will tell the renderer to treat the static column as a field. From here, you can type in a dimension or measure identifier. Depending on your data connection, you may also need to set the table name for the field. To set the table name, click on the column, and navigate to Field in the ribbon menu. From the field ribbon menu, you can set the table name.